• 16K

    Customers

  • 3M

    Users

What makes Zoho Analytics different?

Upload data to reporting tool

Import data from anywhere

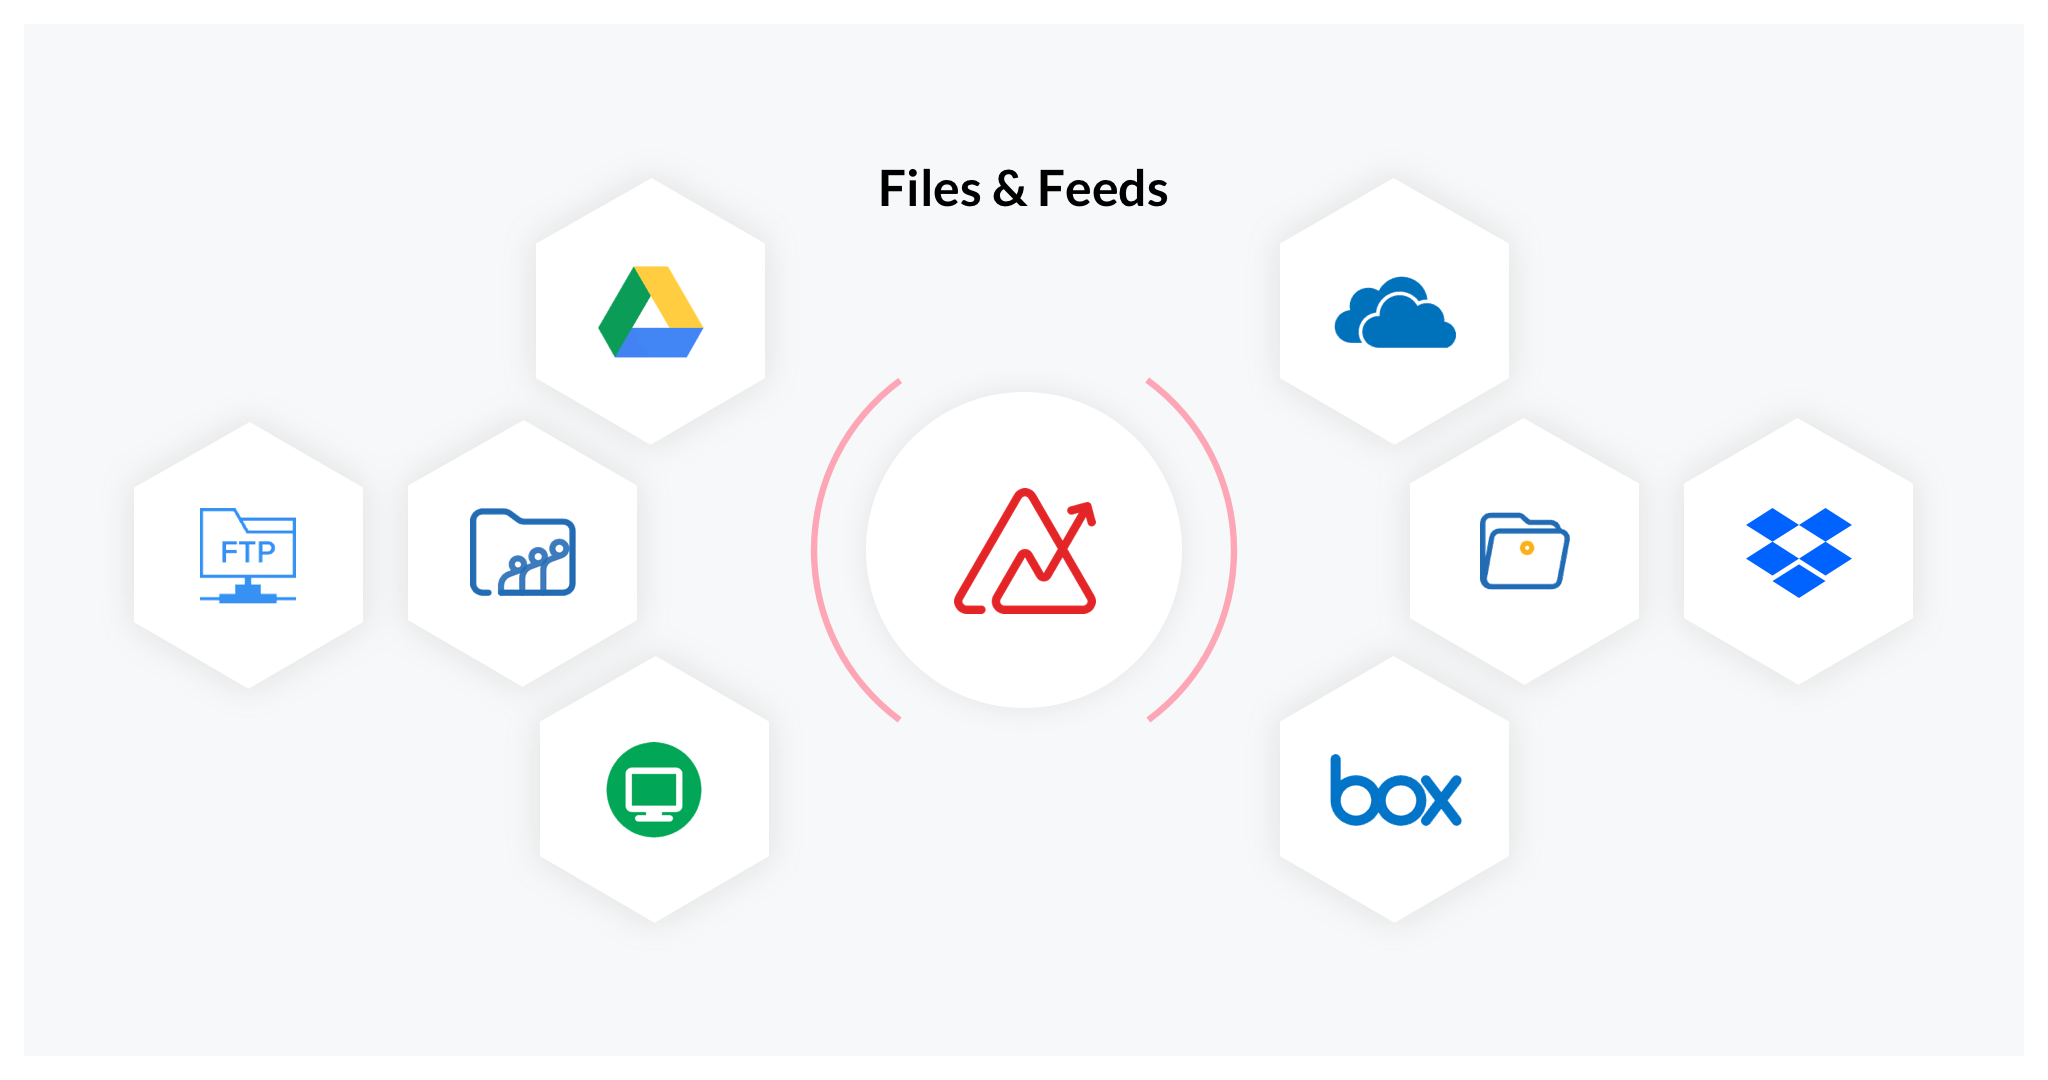
Drag-and-drop your spreadsheets, CSV exports, or JSON files. Connect to Google Drive, Dropbox, or OneDrive. Set a sync schedule (daily, weekly, custom) and the report always pulls from the latest data. No manual re-uploads. No version confusion.

Learn more about integration

Push data via API

Push data from custom applications or internal tools using our REST API. Send records in real-time or batch upload in bulk. Developers get complete API documentation, SDKs for multiple languages, and webhook support for event-driven updates. Your app writes to Zoho Analytics like it's a database. Your team gets live dashboards without building a reporting layer from scratch.

500+ pre-built connectors

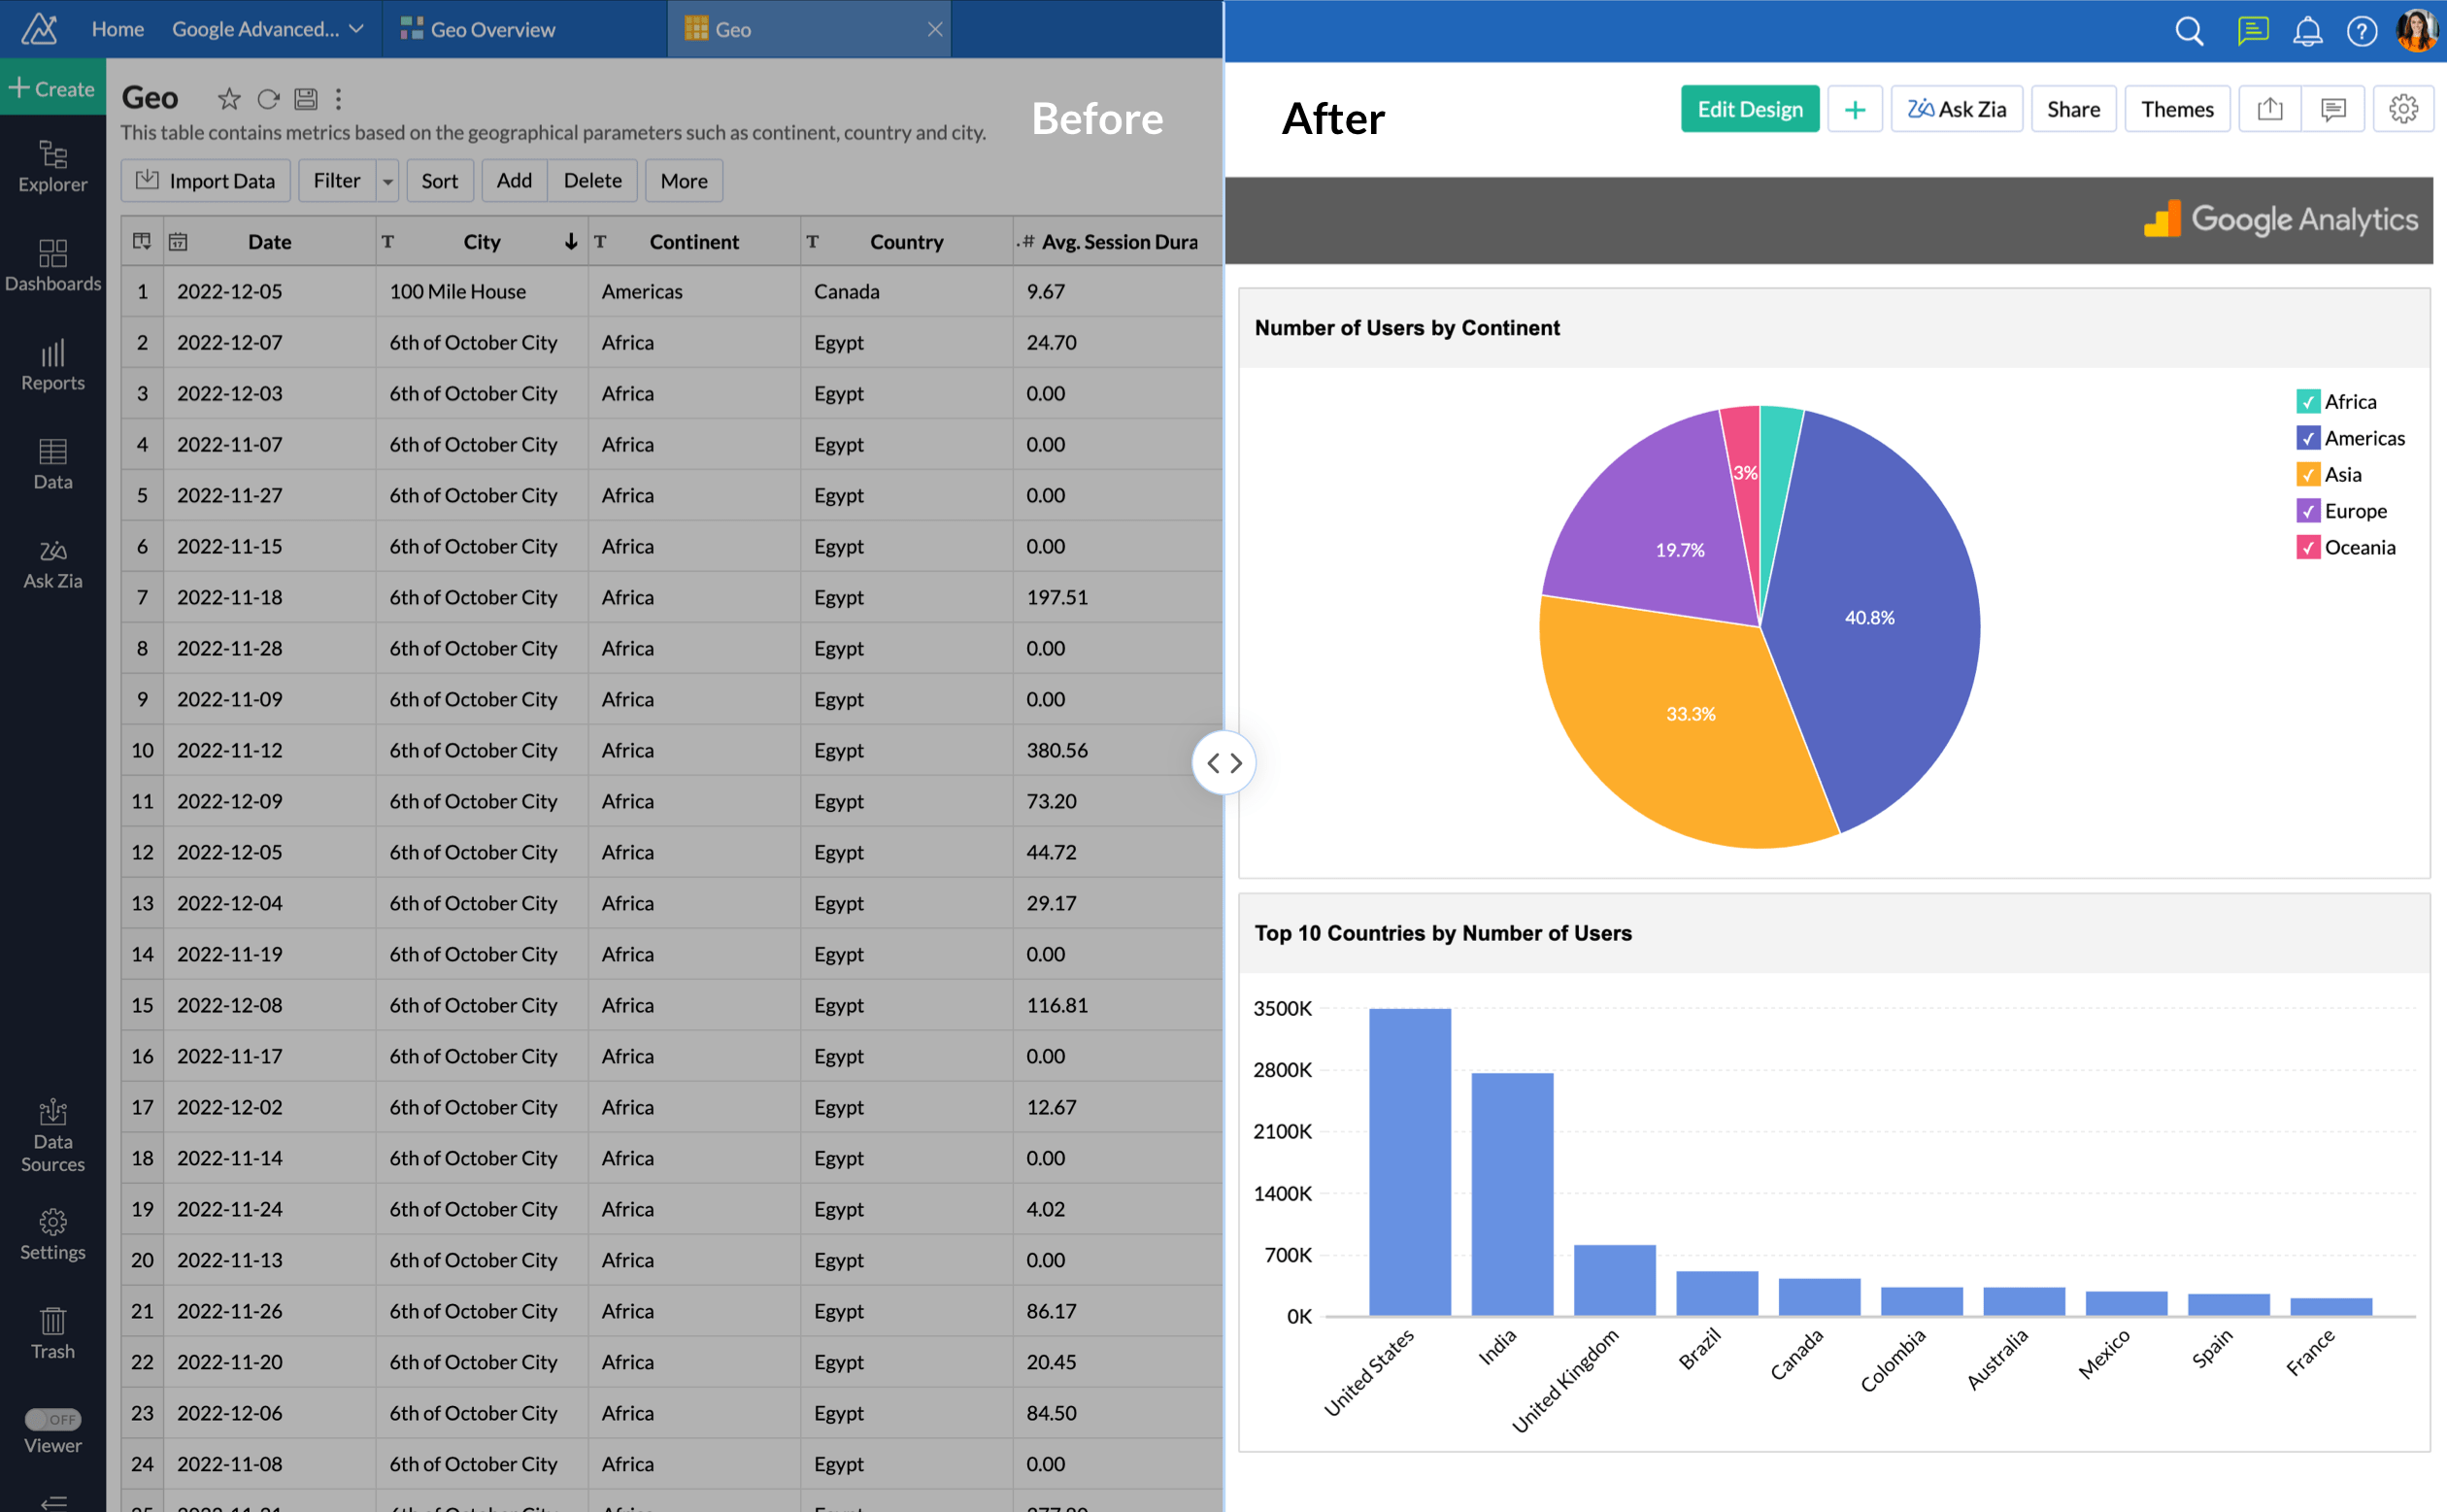
Pre-built connectors for Salesforce, QuickBooks, HubSpot, Zendesk, Google Analytics, Shopify, MySQL, PostgreSQL, Snowflake, Redshift, and 500+ more. Pick your app, authenticate, choose what to sync. Data flows automatically. Zoho Analytics blends data across platforms without code. Your CRM opportunities, support tickets, ad spend, and revenue all land in one place.

View all connectors

50+ visualization types

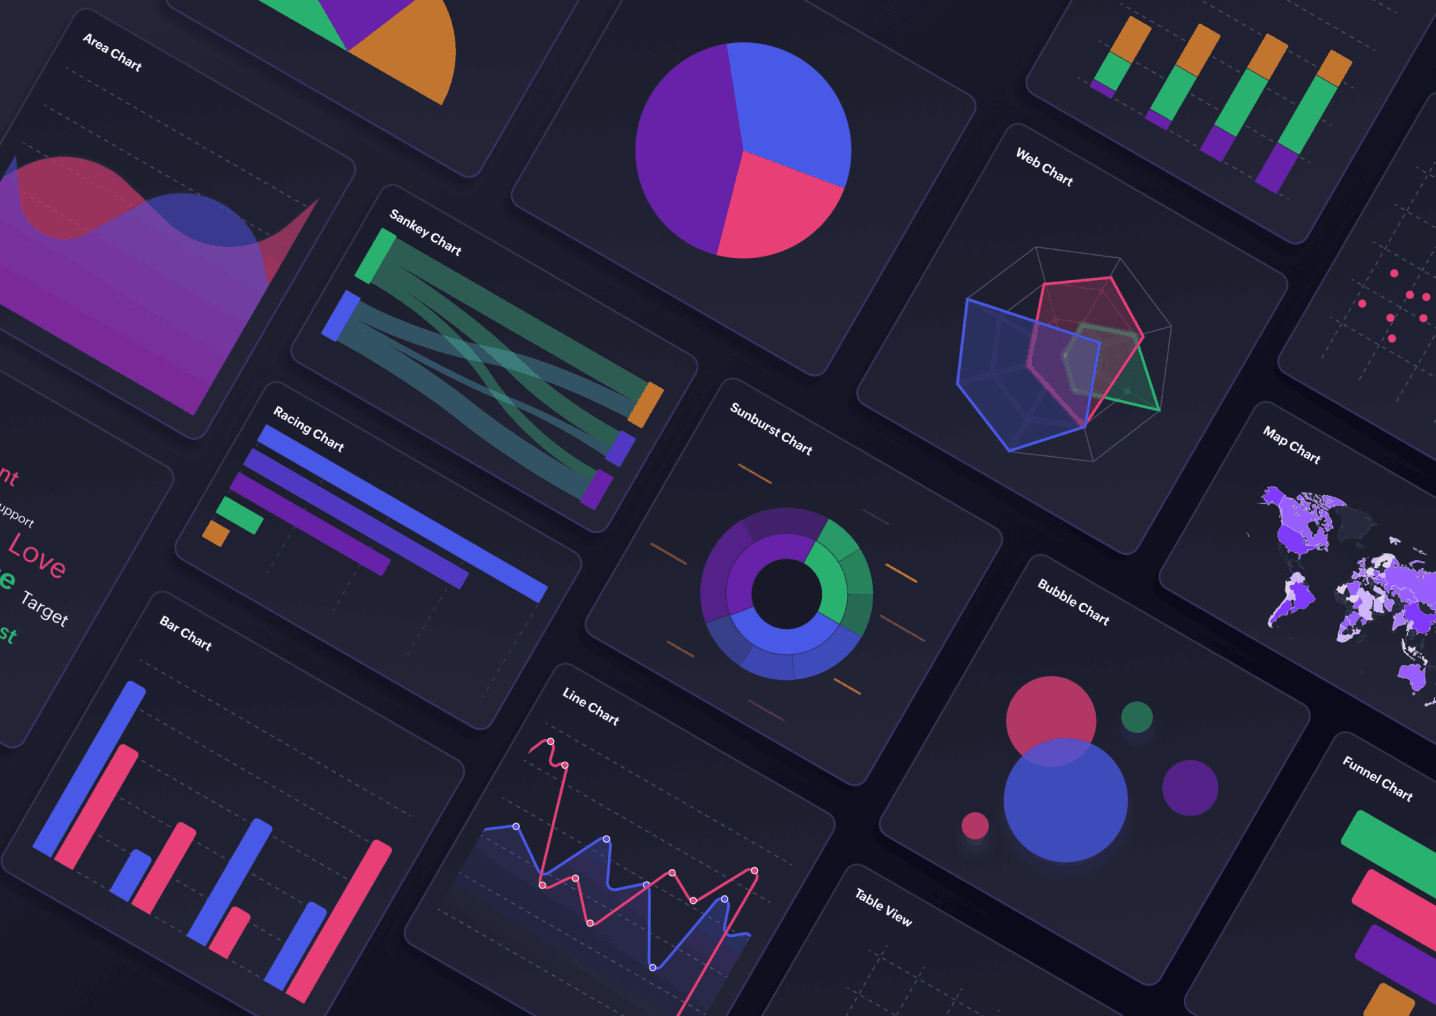
Bar charts, line graphs, pivot tables, heat maps, funnel charts, KPI widgets, geo maps, scatter plots. Pick the data visualization type that makes your point, customize colors, labels, axes, tooltips, and drill-down paths. Click a data point to see the records behind it. Also, you can filter one widget and every chart on the dashboard updates.

Visualization types

See what your data looks like

Browse 50+ chart types with your own data. Connect a source, pick a template, and see live visualizations in under 5 minutes.

Build your first dashboard
No-code report builder

No-code report builder

You can drag dimensions into rows, drop measures into values, apply filters, and pick a chart to create a report. No need to write code, formulas and no waiting on IT. Use calculated fields with Excel-like formulas if something custom is needed. Marketers and analysts can both work from the same tool.

AI that finds patterns automatically

Zia monitors your data continuously and flags anomalies before you ask. Spikes in support tickets. Drops in conversions. Deals that skew your forecast. Zia surfaces them automatically. Ask questions in plain English: "Which regions had the highest churn last quarter?" or "Why did my sales drop?" Zia generates visual and text reports. It explains trends, predicts outcomes, and recommends what to watch next.

AI assisted online reporting software
Embedding your online report

Embed anywhere, share anywhere

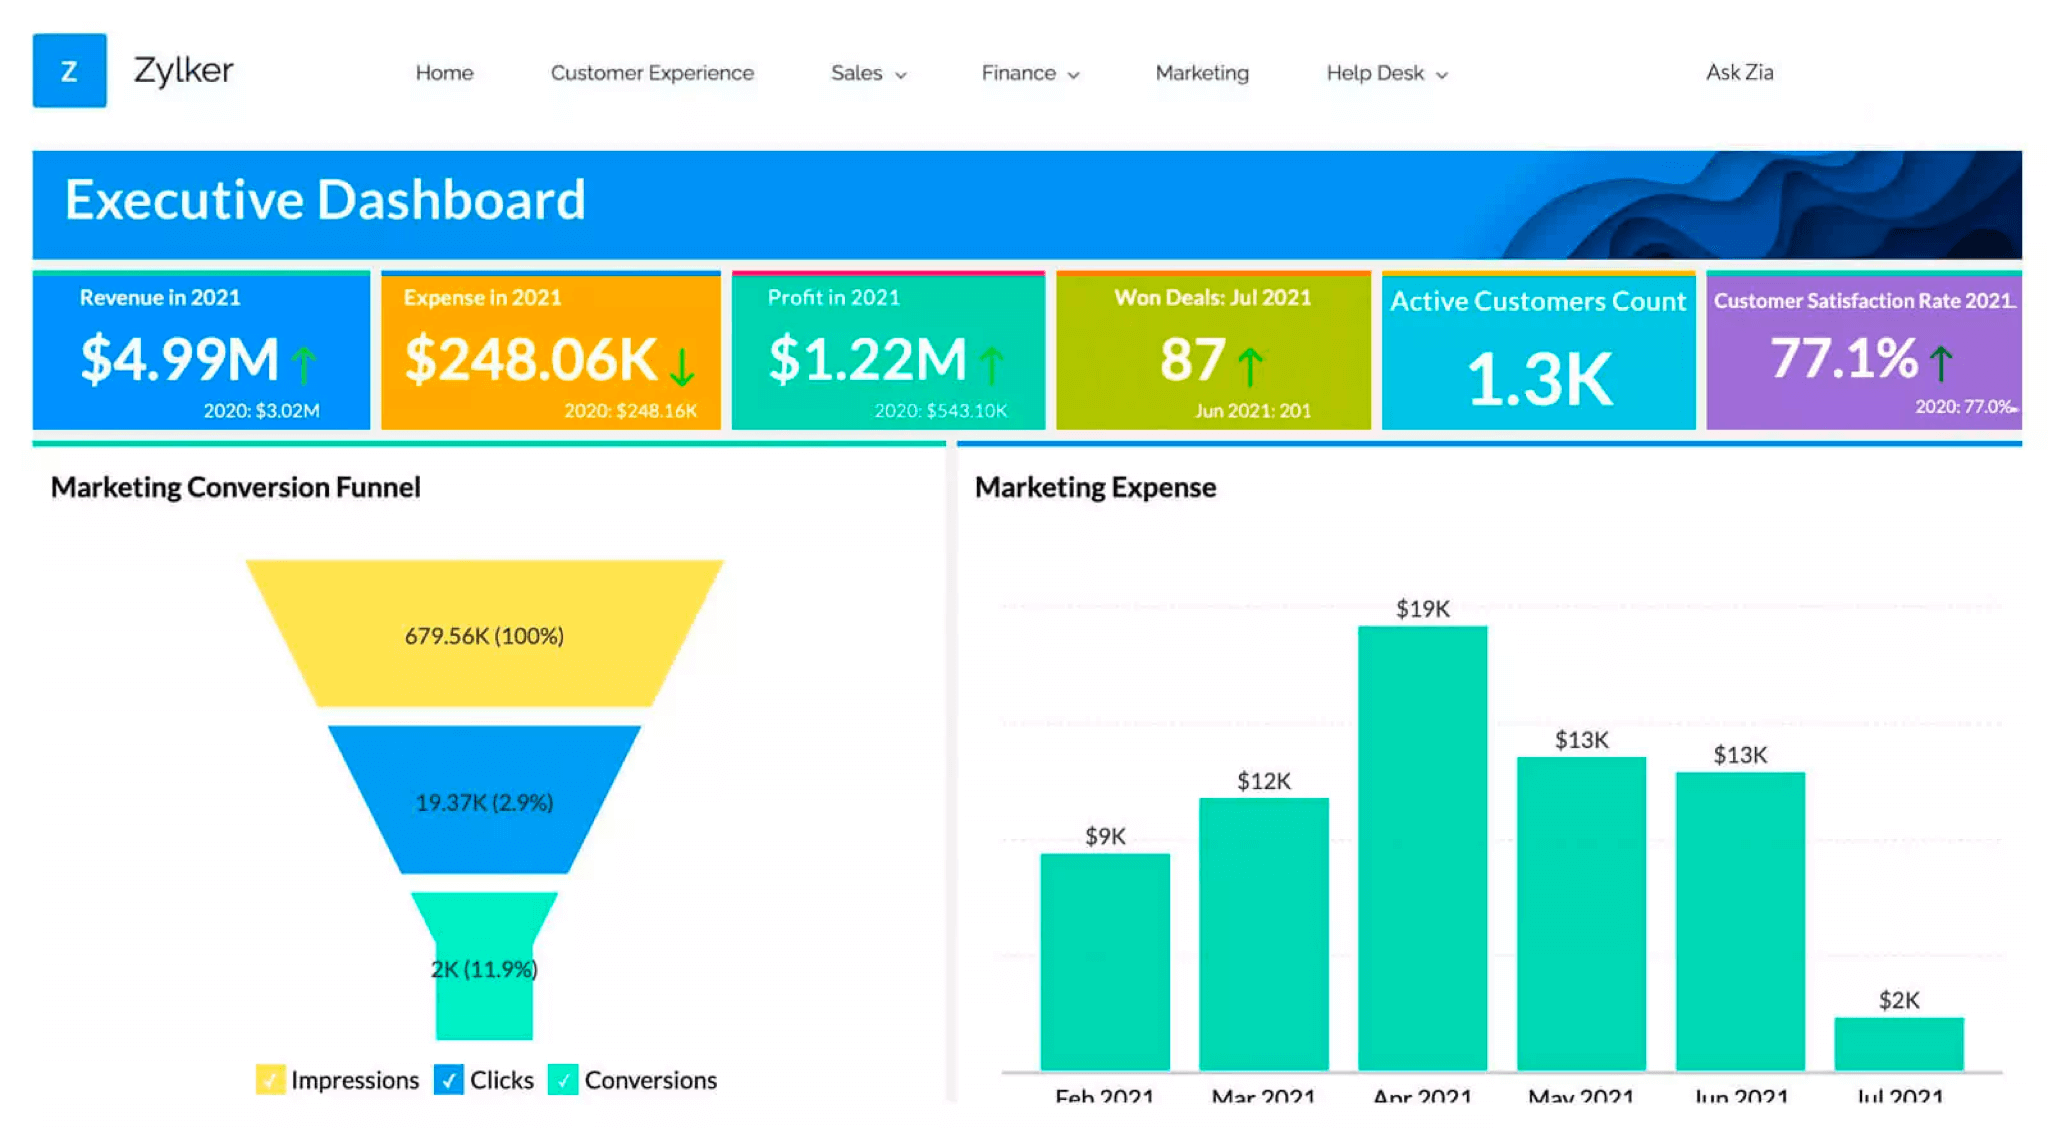
Embed dashboards in your intranet, customer portal, or internal apps. Schedule reports to email or Slack daily, weekly, or when a KPI crosses a threshold. Comment directly on charts, tag teammates, and discuss anomalies without leaving the dashboard. Sales see pipeline health inside the CRM. Customer success tracks health scores in Zendesk. Everyone knows what changed overnight.

Enterprise-grade security and permissions

With role-based permissions sales see sales data, finance see financials, executives see everything. Row-level security filters data by user where reps see only their own deals, managers see their team's performance. Data stays encrypted at rest and in transit. Everything right from audit trails to every access, edit, and export is maintained. SSO, IP whitelisting, two-factor authentication, SOC 2, GDPR, HIPAA compliance supported.

Reporting software for enterprise and small businesses

For small businesses: Reporting that grows with you

You have spreadsheets, QuickBooks, a CRM, maybe Google Analytics. Every report means logging into 4 tools to export data and copy numbers into a master sheet. But Zoho Analytics starts simple. Connect 2 or 3 sources like QuickBooks, your CRM, Google Analytics, and pick a pre-built template. Sales pipeline, cash flow tracker, marketing funnel, support tickets or start with what you need now.

The free plan works for small teams: 2 users, enough data to build one or two dashboards. It has a free plan for small teams (2 users, limited data) and paid plans that start low and scale with you. Build department-specific views in one single platform. No migrations, no rebuilding from scratch.

What small teams get:

  • No IT team required. Drag-and-drop builder, plain English queries
  • Templates for common use cases (sales, marketing, finance, operations)
  • Mobile dashboards for founders tracking metrics on the go
  • Affordable pricing that scales with team size and data volume
  • White-label reporting if you sell services and need client reporting
Start for free

For enterprises: Governance, scale, security

Having hundreds of users across departments and regions means your data lives everywhere like SAP, Oracle, custom databases, and third-party apps. Zoho Analytics lets you connect to data warehouses including Snowflake, Redshift, BigQuery and others so you're not duplicating data across systems. With row-level security, users only see data they're authorized for. Role-based workspaces separate sales, finance, HR, and operations so data stays where it belongs. SSO, IP whitelisting, and two-factor authentication handles authentication. SOC 2 Type II, GDPR, and HIPAA compliance are built-in by default.

What enterprises get:

  • Direct warehouse connections (Snowflake, Redshift, BigQuery). No data duplication.
  • Row-level security and role-based access control
  • Certified datasets and consistent metric definitions across departments
  • Full audit trails for compliance (SOC 2, GDPR, HIPAA)
  • SSO, IP whitelisting, advanced authentication
  • Sandbox environments for testing before publishing
  • API access for custom integrations and programmatic workflows
  • Dedicated support and onboarding for large rollouts
  • Volume pricing and enterprise agreements
Request a demo

Use cases

Sales: Pipeline intelligence that closes deals faster

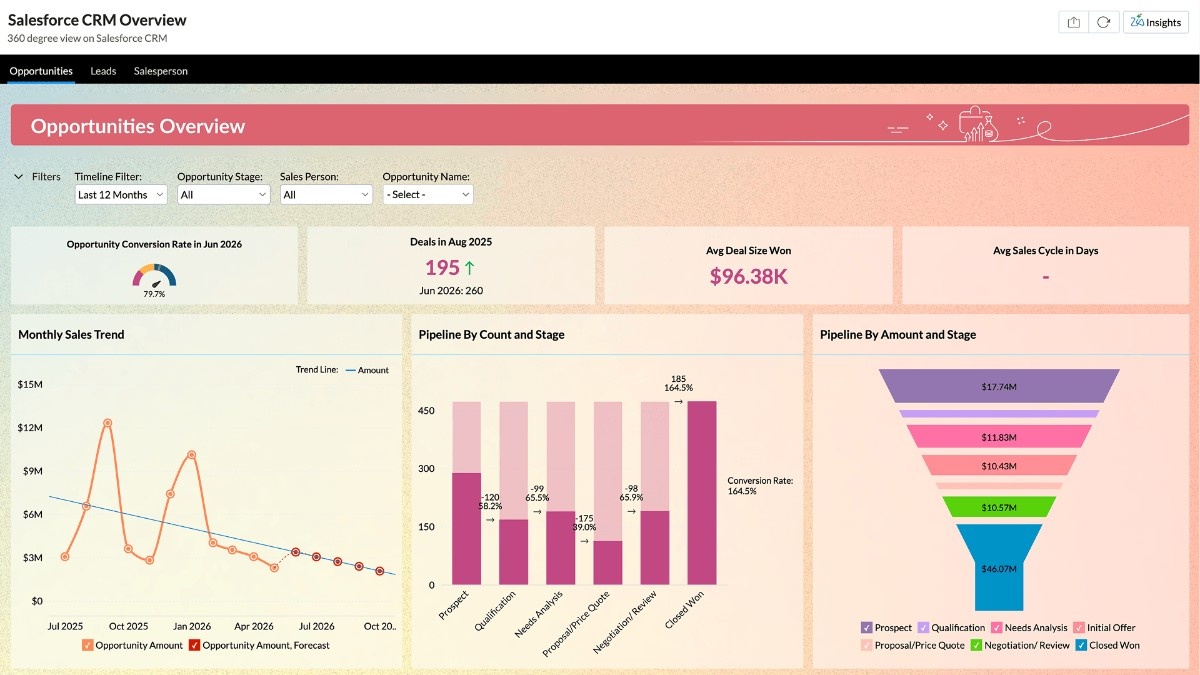
See which deals stalled and why. Compare close rates by rep, by region, by quarter. Track which lead sources convert.

Marketing: Prove ROI and optimize every dollar

Track CAC by channel. See which campaigns drive revenue and which burn budget. Measure funnel drop-off at every stage.

Finance: Real-time visibility into business health

Generate P&L statements, cash flow reports, budget vs. actuals. Monitor AR/AP aging. Forecast revenue from pipeline velocity.

Customer success: reduce churn, grow accounts

See which accounts have rising ticket volume or dropping product usage. Flag churn risk before renewal dates. Spot upsell opportunities based on feature adoption.

Operations and IT: monitor performance and uptime

Monitor inventory, supply chain delays, system uptime, and incident response times. Predict when equipment needs maintenance. Adjust resource allocation from actual usage.

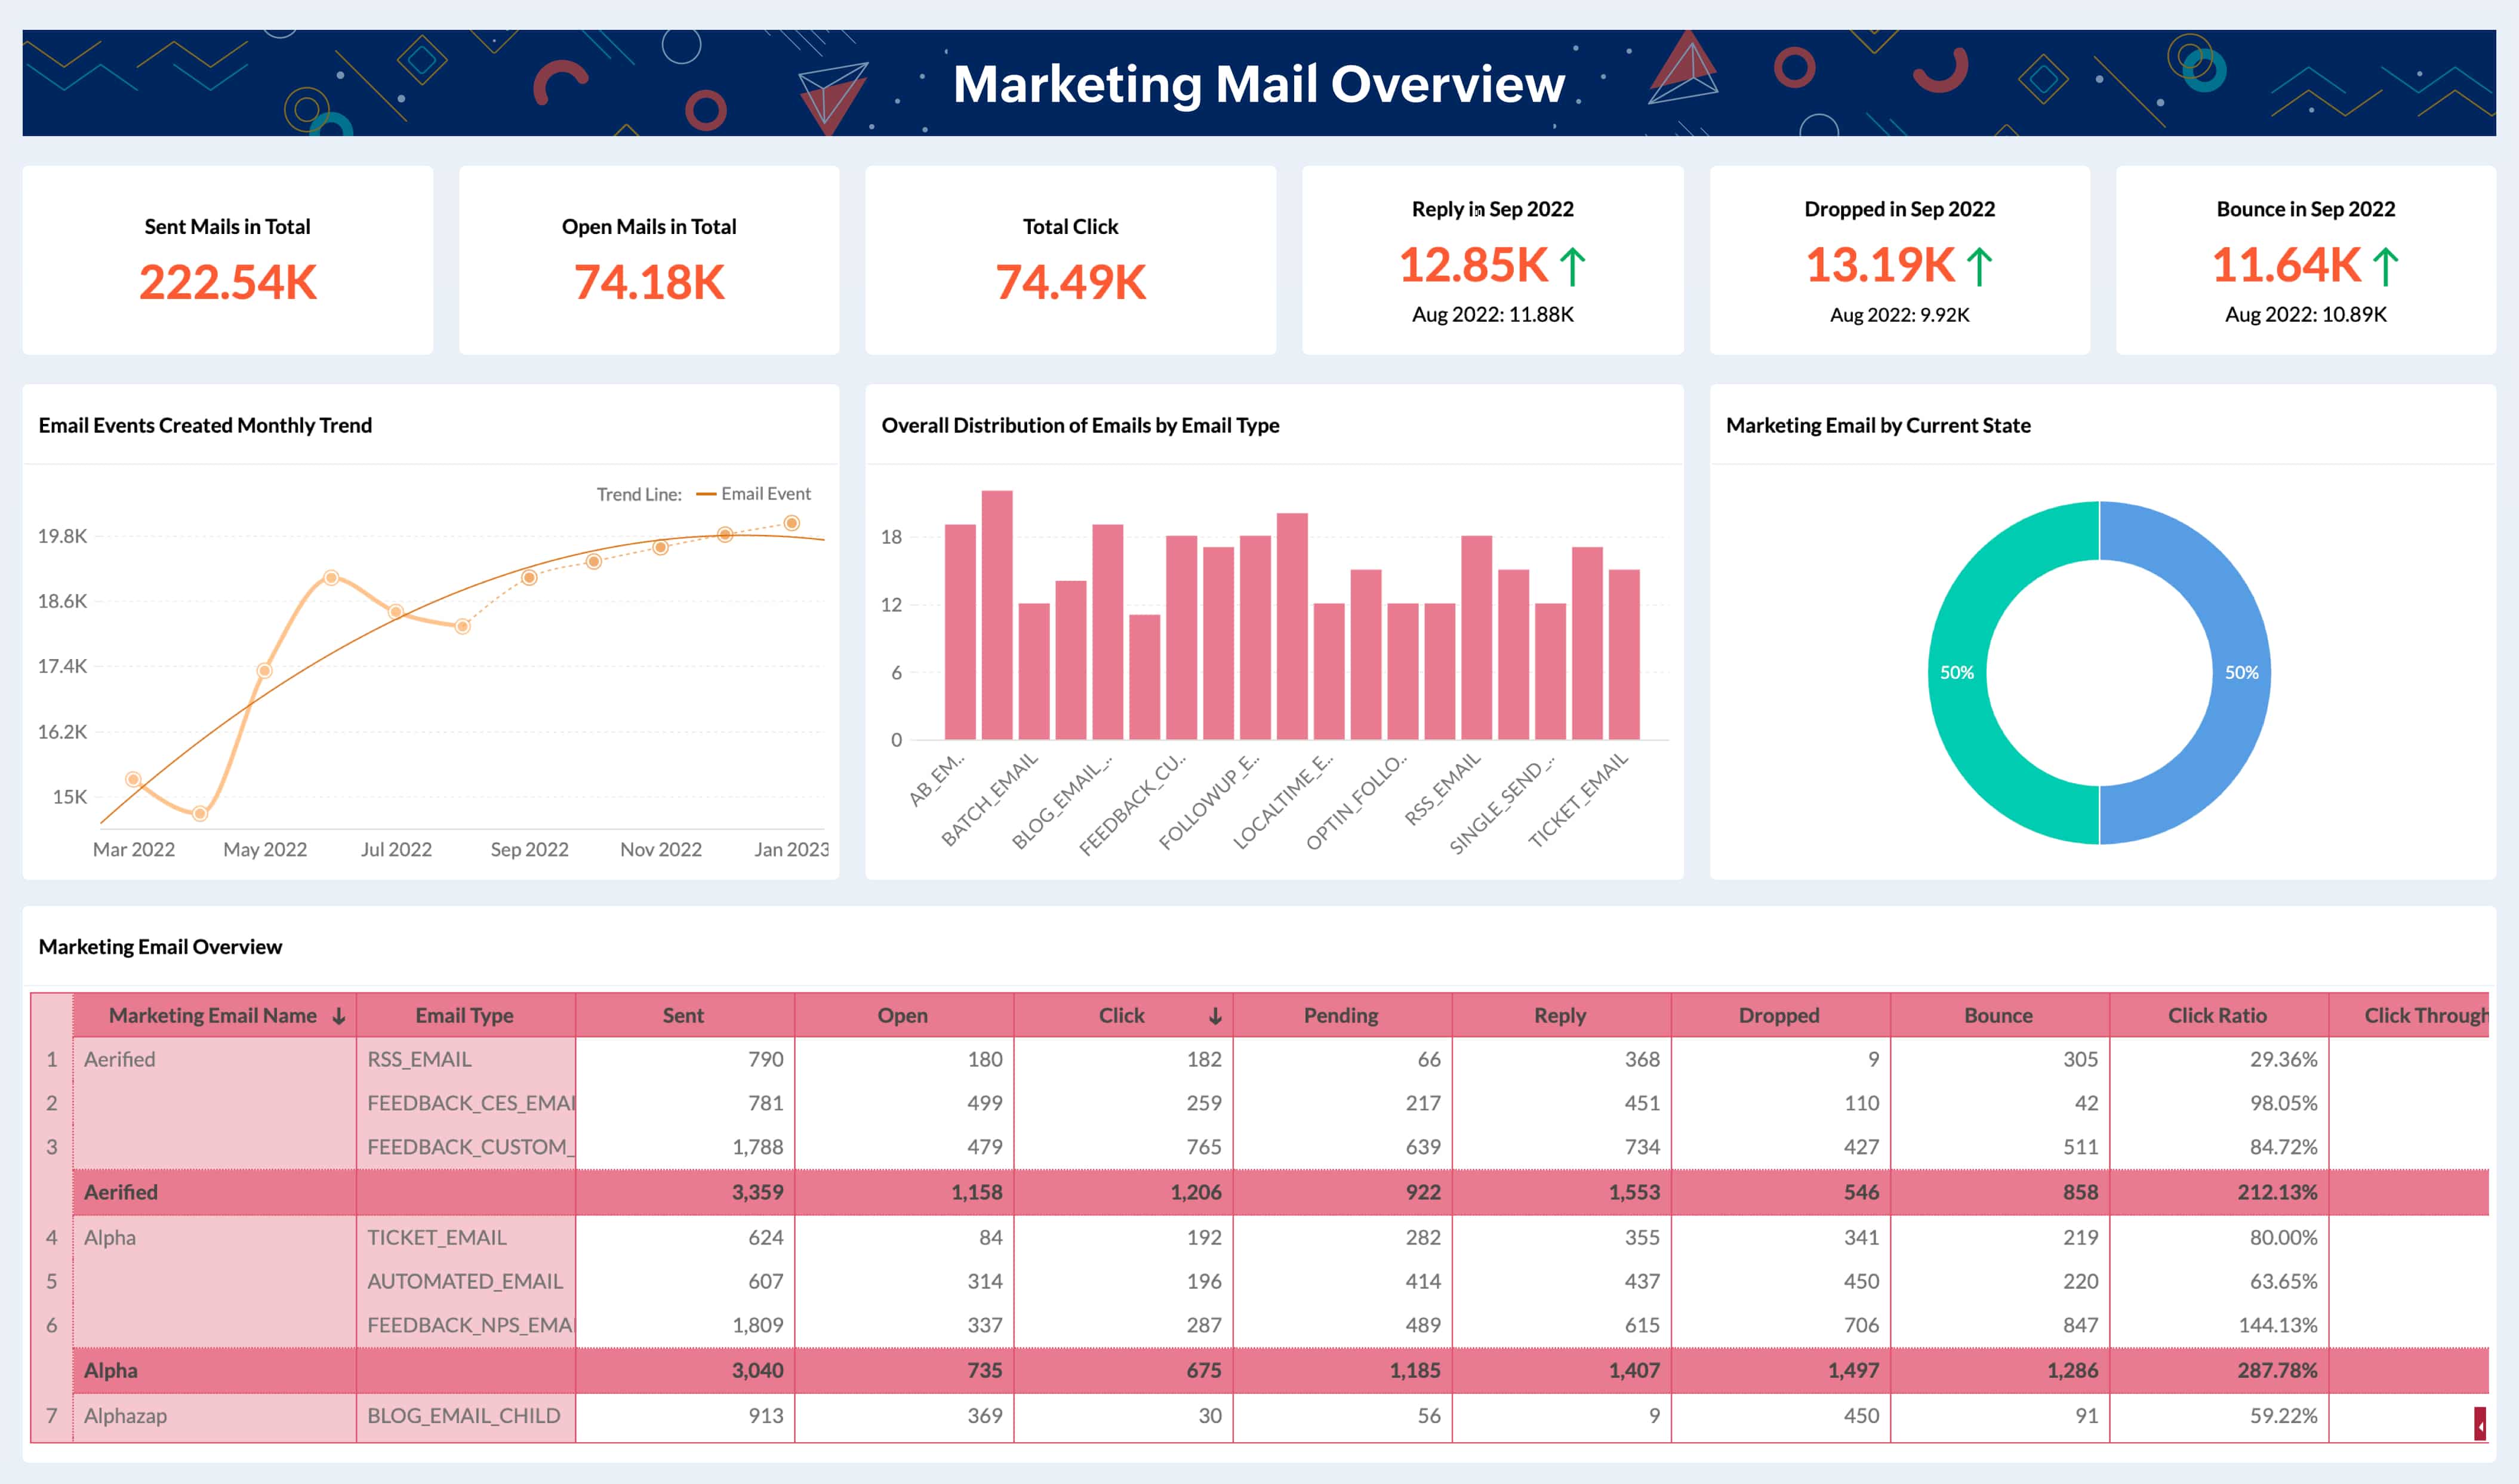
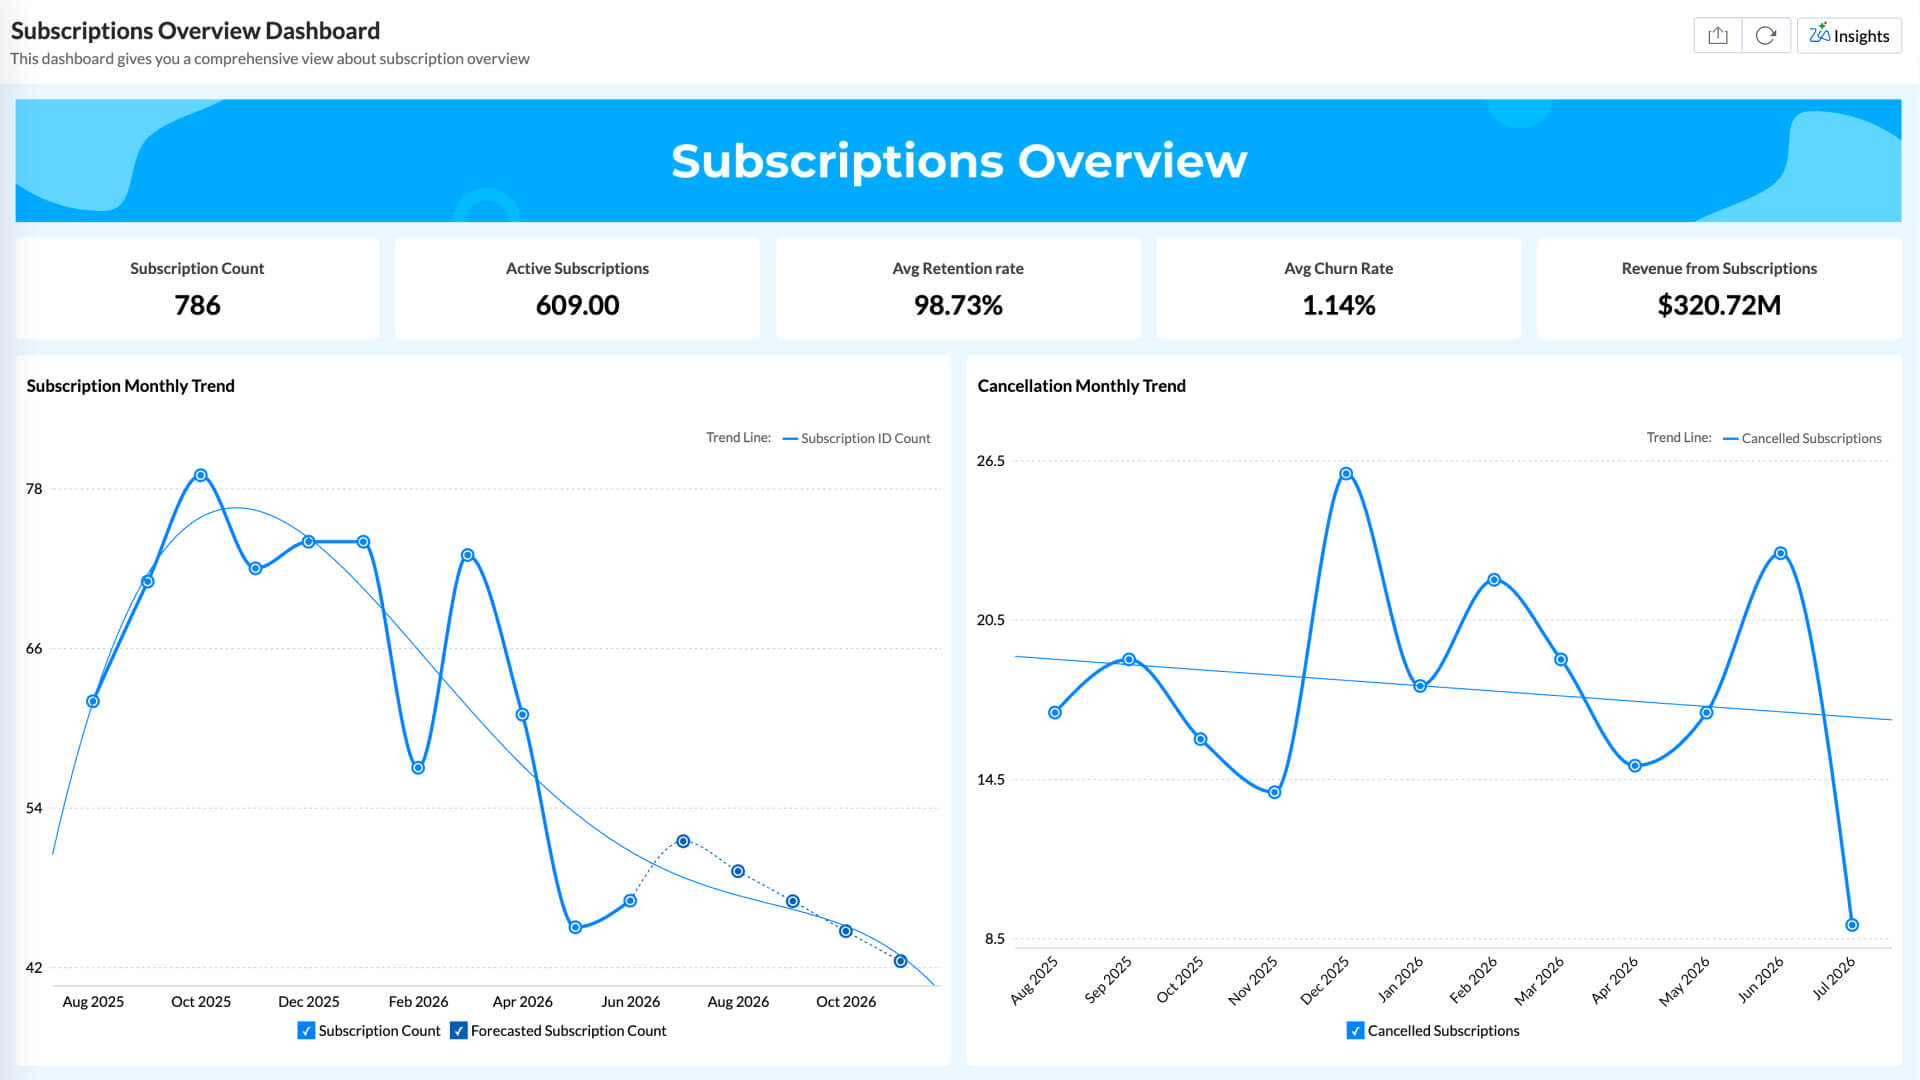
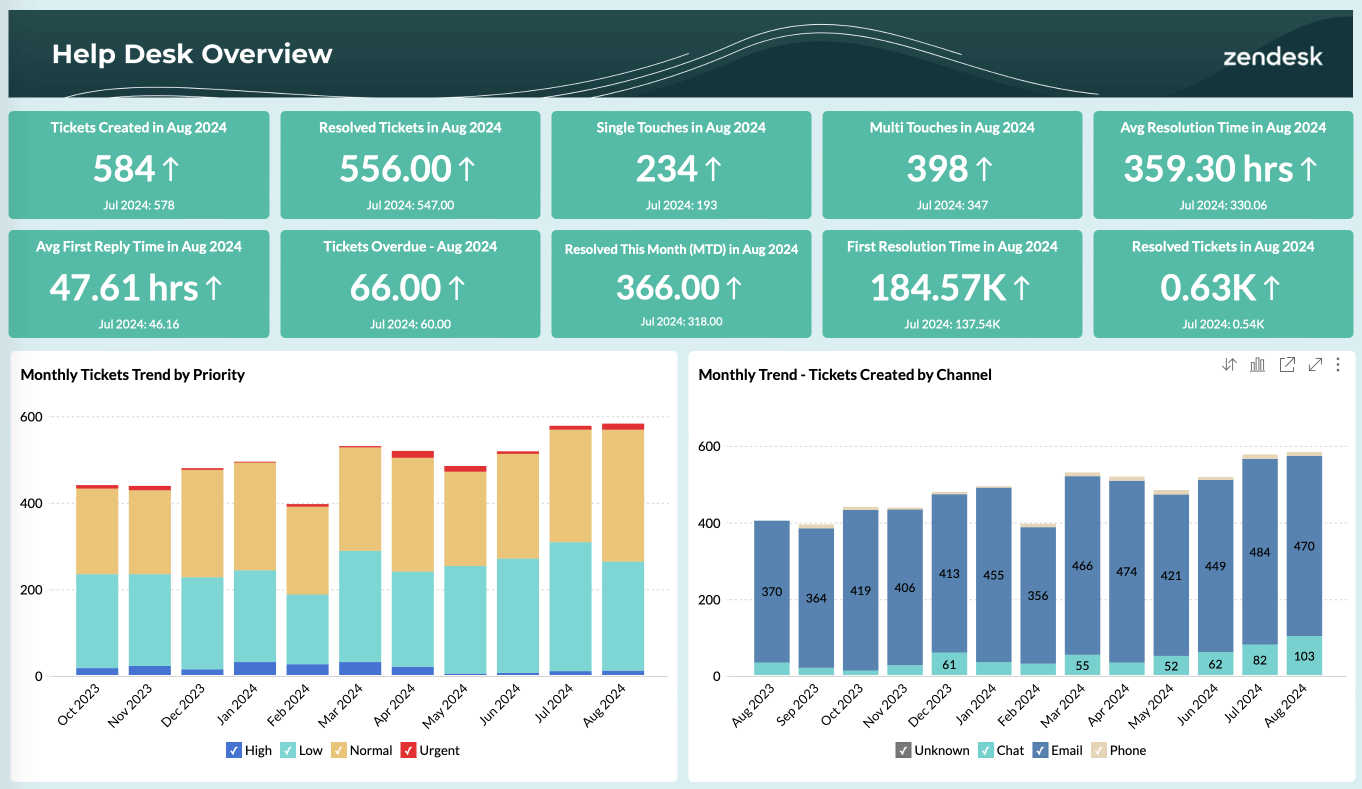
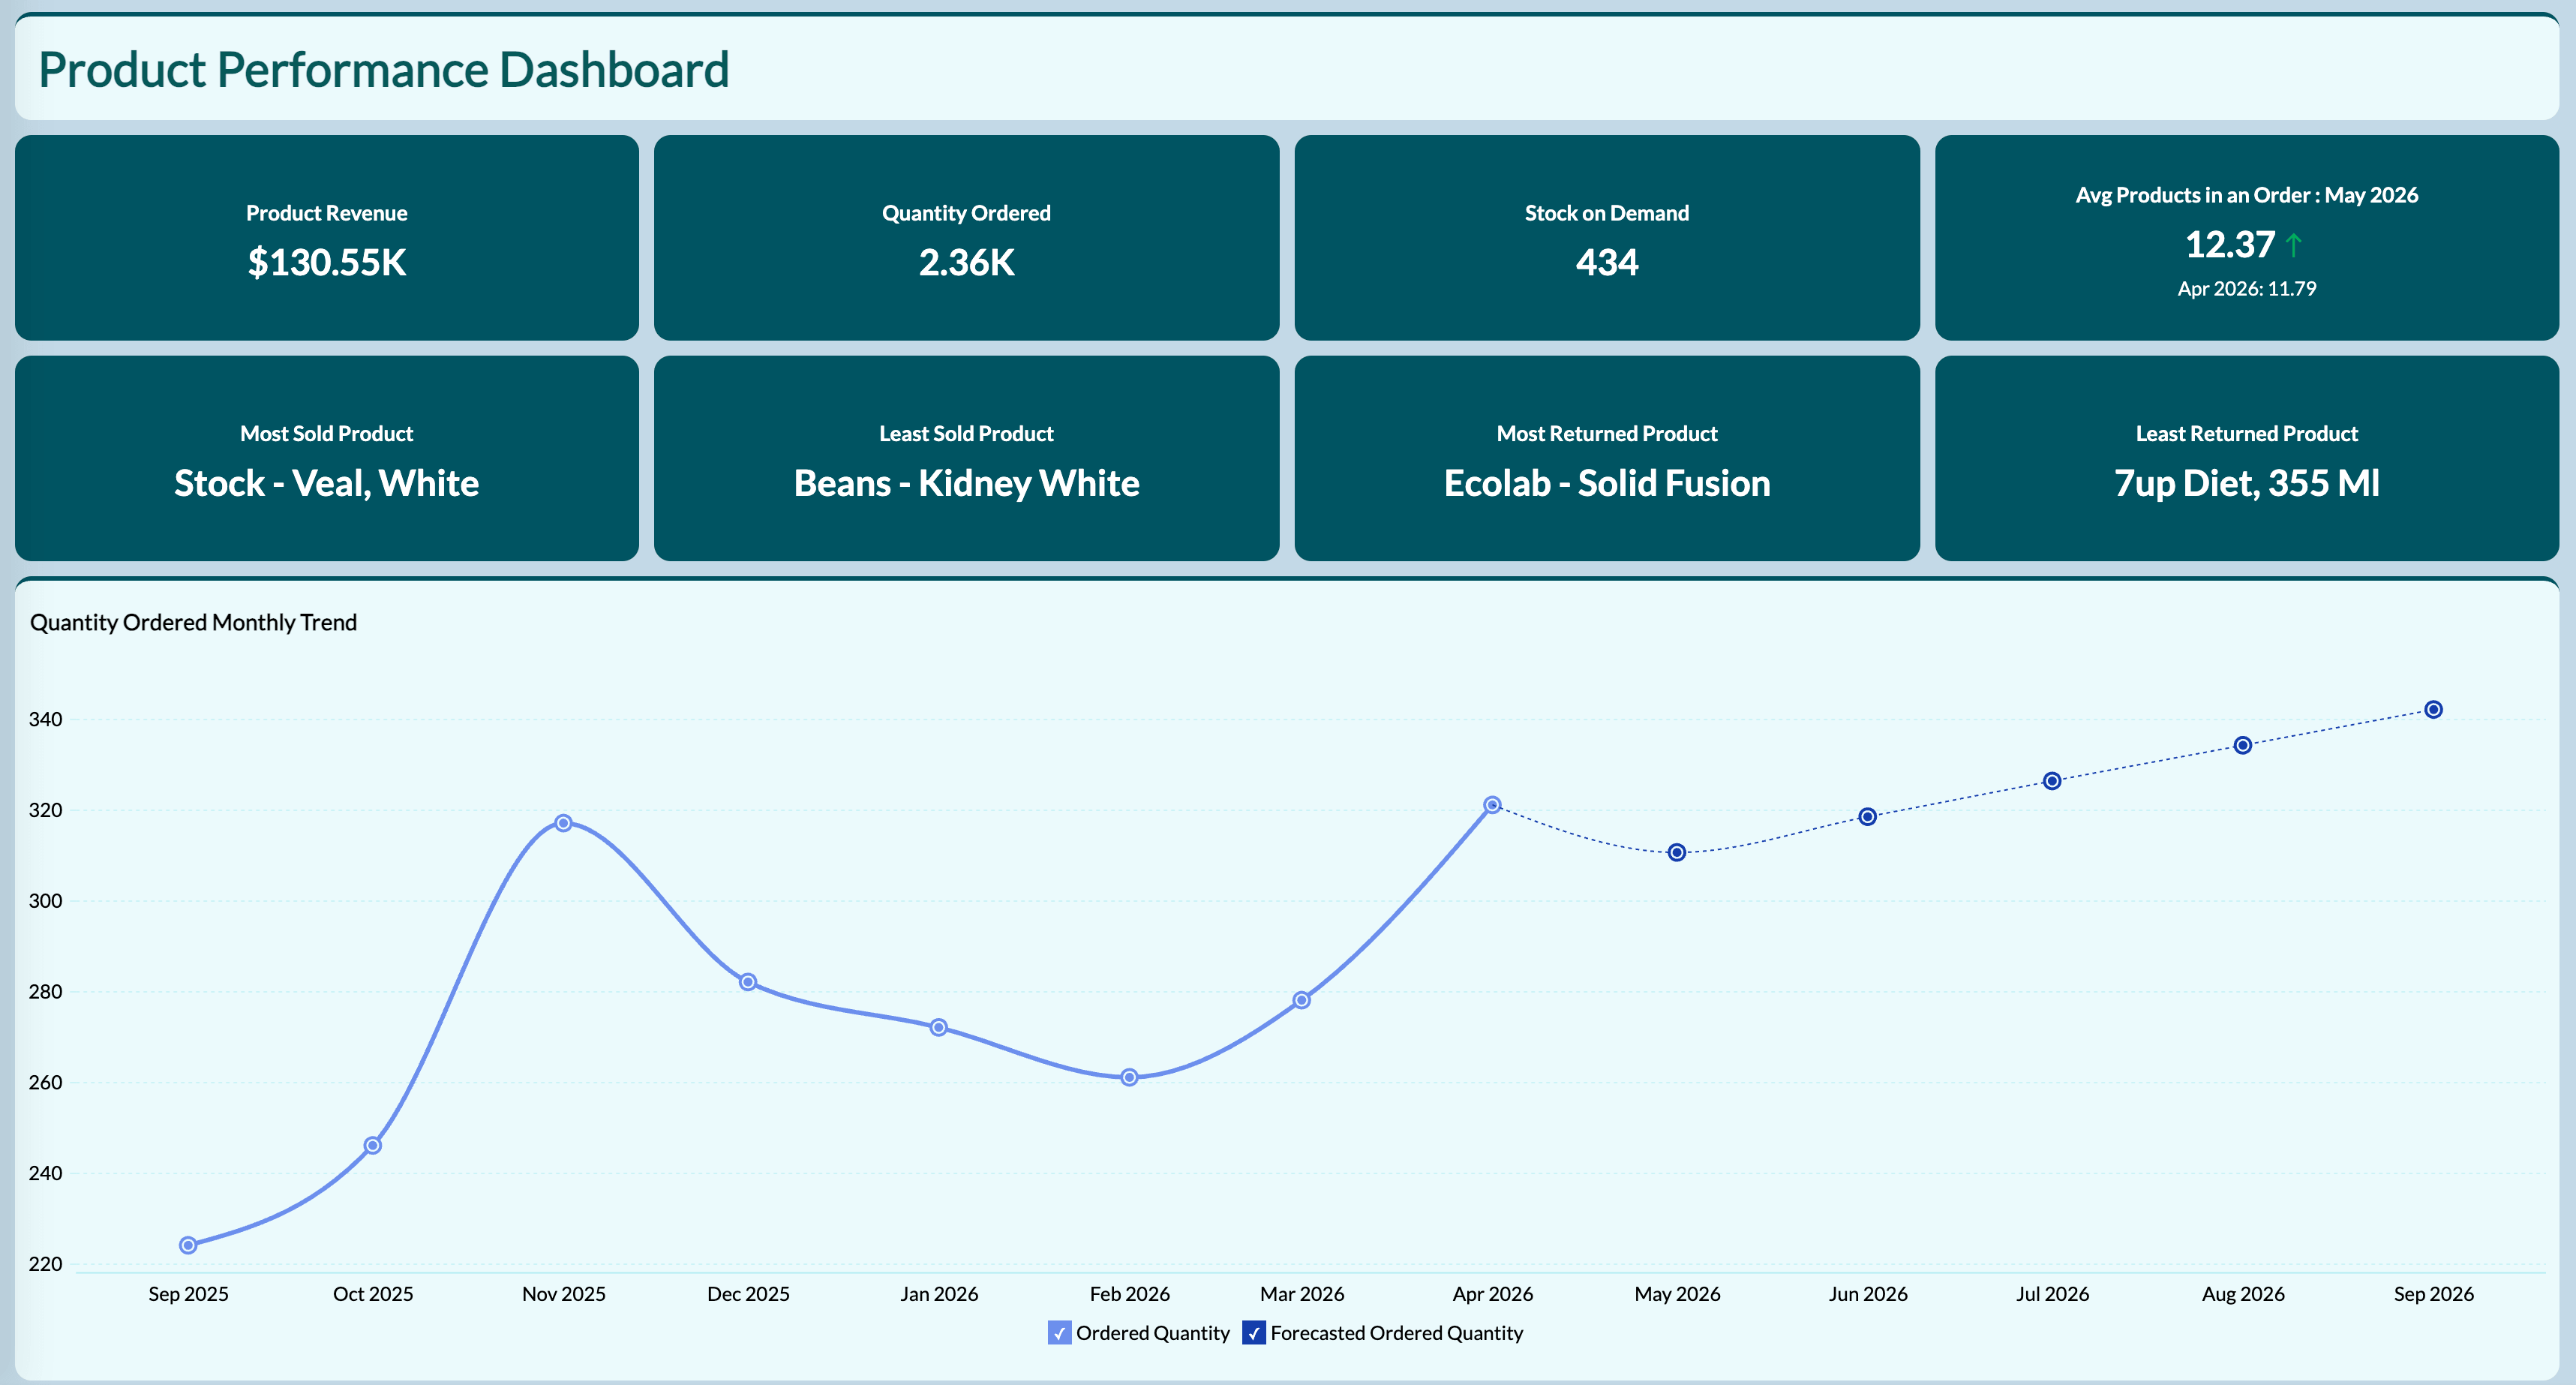
Sales pipeline dashboardMarketing ROI dashboardFinance business health dashboardCustomer success dashboardOperations and IT dashboard

Hear from our happy customers

Simone Drera
Simone Drera
VP-Business Development, Flexxaire Inc.

"We wanted a simple BI solution to analyze our sales, project, and quality data. The tool also needed to be capable of integrating multiple tables, creating models to create charts that could be shared seamlessly across teams."

Moises Ochoa
Moises Ochoa
Application Engineer, Cementos Progreso

"With Zoho Analytics, the time spent in creating charts, reports and dashboards went down by 50%. More importantly, our software expenses were reduced by 30%!"

Marc Andrew
Marc Andrew
Senior Developer, Rental Car Manager

"Our main alternate would have been Power BI, but we quickly found that the pricing and user-friendliness wouldn't quite work for a lot of our customers."

Start building reports that actually drive decisions

Connect your data sources, explore insights instantly, and share dashboards with your team — no IT required.

Signup for free

FAQs

What is reporting software?

  • Reporting software is a digital tool that collects, organizes, analyzes, and presents data in structured formats, such as dashboards, charts, or reports. It transforms raw data into actionable insights for decision-making, performance tracking, and compliance.

What features should I look for in reporting software?

  • Key features to consider include:
    • Customizable dashboards and reports
    • Data visualization tools (charts, graphs, heatmaps)
    • Integration with various data sources (databases, spreadsheets, cloud apps)
    • Automated reporting and scheduling
    • Interactive and real-time reports
    • User access controls and permissions
    • Collaboration tools
    • Mobile accessibility
    • Data security compliance
    • Support for exporting and sharing reports

How easy is it to implement and use reporting software?

  • Zoho Analytics and similar tools are designed for quick setup with no-code or low-code interfaces. Implementation speed depends on the software's UI, available integrations with your current systems, onboarding resources, and support quality. Cloud-based solutions are easier to implement because they require no local installation.

Can reporting software help track key performance indicators (KPIs)?

  • Yes! Reporting software often includes dedicated KPI tracking features. You can set, monitor, and visualize KPIs through widgets, dashboards, and alerts, providing at-a-glance status of your key metrics.

What types of reports can reporting software generate?

  • Common types include:
    • Tabular and summary reports
    • Charts (bar, line, pie, etc.)
    • Drill-down and interactive dashboards
    • Financial and sales reports
    • Operational/management reports
    • Custom and ad hoc reports

Can reporting software handle real-time and automated reporting?

  • Yes. Leading solutions provide:
    • Real-time data fetching and reporting
    • Automated report generation and delivery (via email, PDF, shared links)
    • Trigger-based alerts

What data sources can reporting tools connect to?

  • Modern tools connect to:
    • SQL and NoSQL databases
    • Excel and Google Sheets
    • Cloud services (Salesforce, Google Analytics, Zoho apps, etc.)
    • APIs and flat files (CSV, JSON)
    • Business platforms (ERP, CRM, HRM)
  • Zoho Analytics, for example, connects with hundreds of sources.

Is reporting software suitable for non-technical users?

  • Most current tools prioritize user-friendliness. Drag-and-drop interfaces, guided wizards, and template galleries make them accessible for non-technical users. Solutions like Zoho Analytics are particularly noted for their intuitive UI.

How secure is reporting software for business data?

  • Look for features like:
    • End-to-end encryption (in transit & at rest)
    • Role-based access control
    • Audit trails and activity logs
    • Compliance with standards (GDPR, SOC2, HIPAA)
    • Cloud-based options (including Zoho Analytics) provide enterprise-grade security

What are the best reporting tools to use in 2026?

  • The best reporting tools for 2026 include:
    • Zoho Analytics
    • Microsoft Power BI
    • Tableau
    • Google Data Studio (Looker Studio)
    • Qlik Sense
    • Sisense
    • Domo
  • Zoho Analytics is known for its value, feature depth, and ease of use.

Why is Zoho Analytics considered one of the best reporting tools in 2026?

  • Zoho Analytics offers:
    • 500+ data source integrations, including Zoho's suite and third-party apps
    • Drag-and-drop report building with AI-powered assistant (Zia)
    • Affordable pricing with clear plans
    • Extensive templates and visualization options
    • Strong data protection and compliance
    • Scheduled reports, data sync, and alerts
    • Easy sharing, embedding, and real-time team collaboration